Overview dashboard
The Overview dashboard is the page you check every Monday. It surfaces high-level trends — is volume up, what channels are growing, where’s the bot struggling — in a single view.
In this guide:
- Open the dashboard
- The KPI cards at the top
- The charts
- The bottom panels
- Date range and filters
Step 1: Open
In the left sidebar, click Analytics → Overview. Or for a single bot, Chatbot → Analytics.
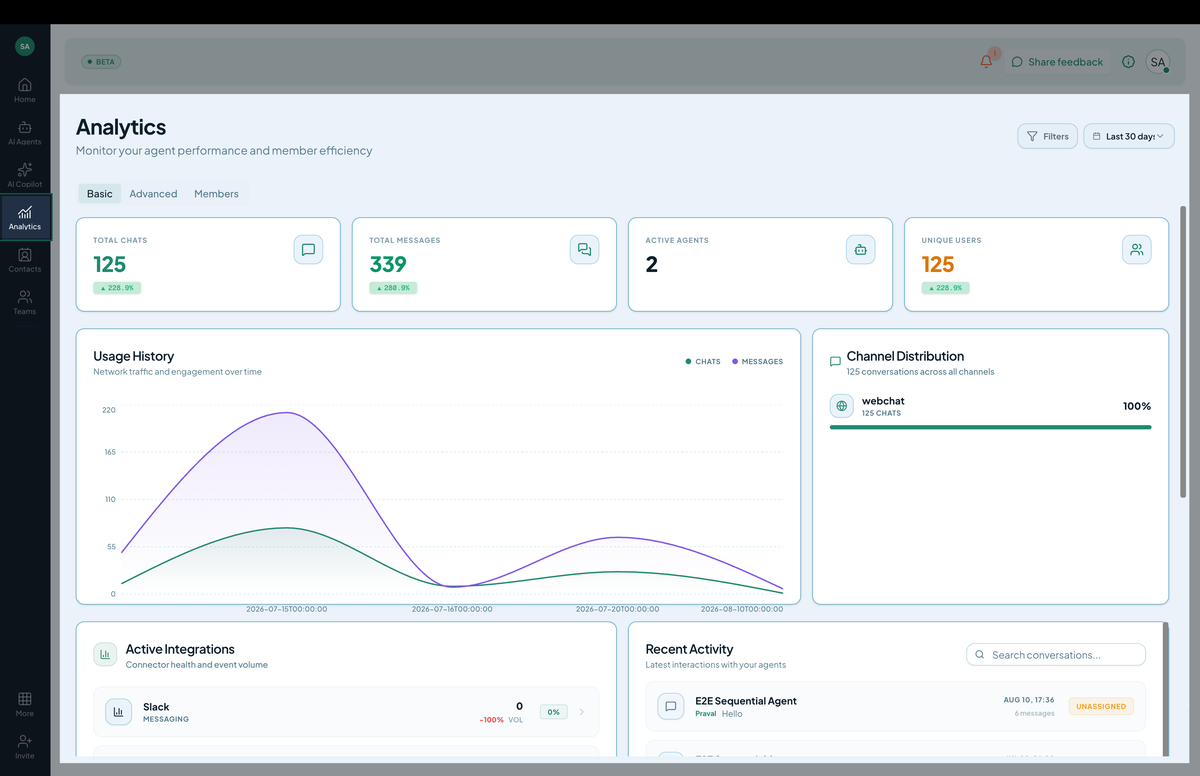
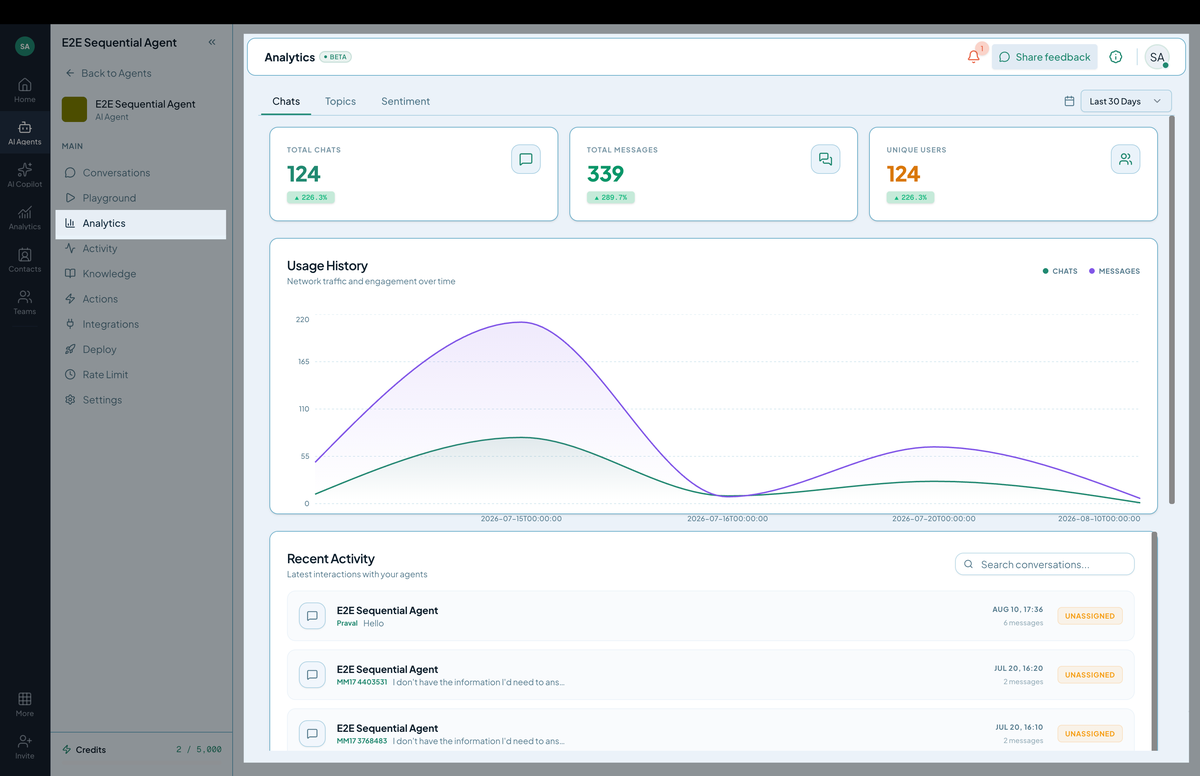 Screenshot: The Analytics overview dashboard with KPI cards and trend charts.
Step 2: KPI cards
Top of the page shows:
- Total conversations in the date range.
- Active chatbots — how many bots are seeing traffic.
- Unique users / Unique sessions.
- Resolution rate — % closed without escalation.
- Escalation rate — % handed off to humans.
- CSAT — customer satisfaction average from feedback forms.
- Avg handle time (AHT) — for live agent conversations.
Each card has a small sparkline showing trend vs. the previous period.
Step 3: Charts
Below the KPIs:
- Conversation volume — line chart, conversations per day. Spikes tell you a campaign worked or a feature broke.
- Channel breakdown — pie chart of web / Slack / email / WhatsApp / Messenger.
- Sentiment distribution — positive / neutral / negative %, derived from message tone.
- Peak usage heatmap — hours × days; shows when your customers are most active. Use this to staff agents.
Step 4: Bottom panels
- Top queries — most frequent topics. Use these to write better knowledge.
- Recent conversations — quick links into specific conversations.
- Resolution by agent — for teams, who’s clearing the most tickets.
Filters
Top bar:
- Date range: today, 7d, 30d, 90d, custom.
- Chatbot: filter to one bot or compare several.
- Channel: web, email, Slack, etc.
- Tag: filter to conversations with a specific tag.
Filters apply to the entire dashboard.
Tips
- Compare periods. “vs. last month” is more meaningful than “this month.”
- Watch for sentiment drift. A growing % of negative sentiment is your earliest warning sign.
- Click into top queries. Each links to a filtered conversation list — read 5–10 to understand what’s behind the count.